Every week brings a new list of "jobs AI will replace." Almost none of those lists check whether the jobs on them are actually disappearing. So we did. We took the best available measure of where large language models are already doing work, matched it to official US employment counts for 722 occupations, and asked a simple question: six years on from 2019, and nearly three years on from ChatGPT, do the jobs most exposed to AI have fewer people in them?
AI exposure explains about 1% of the variation in how US occupations grew or shrank between May 2019 and May 2025. The most exposed occupation groups (business, finance, computing) grew fastest. The relationship that does exist was already there before ChatGPT launched. Displacement is visible in a short list of clerical and support jobs, most of which were already declining. If you want the number for your own job, use the lookup tool.
In this analysis
1. The question, and why the usual answer is wrong
The usual answer comes from exposure studies: a model or a panel of experts reads the list of tasks in each occupation and scores how many an AI could, in principle, perform. Those studies are useful, and we use two of them below. But "could be done by AI" is a statement about capability, not about payrolls. An occupation can be 70% exposed and still be hiring, because the tasks AI takes over are the ones nobody was paid much for, because demand for the output rose, or because the technology has not been deployed.
The second usual answer comes from anecdotes: a company announces layoffs and mentions AI in the press release. That is evidence about one firm's messaging, not about the labour market. The only way to answer the question is to count the people employed in each occupation before and after generative AI arrived and see whether the exposed ones moved differently from the rest. That is what this article does, and we committed in advance to publishing the result whichever way it came out.
2. What the data shows
Our employment data is the US Bureau of Labor Statistics' Occupational Employment and Wage Statistics (OEWS), which counts wage-and-salary jobs in roughly 830 detailed occupations each May. Total employment rose from 146.9 million in May 2019 to 155.5 million in May 2025, a gain of 5.9%. The chart below ranks the 22 major occupation groups by their change over that period and colours each bar by how exposed the group is to AI.
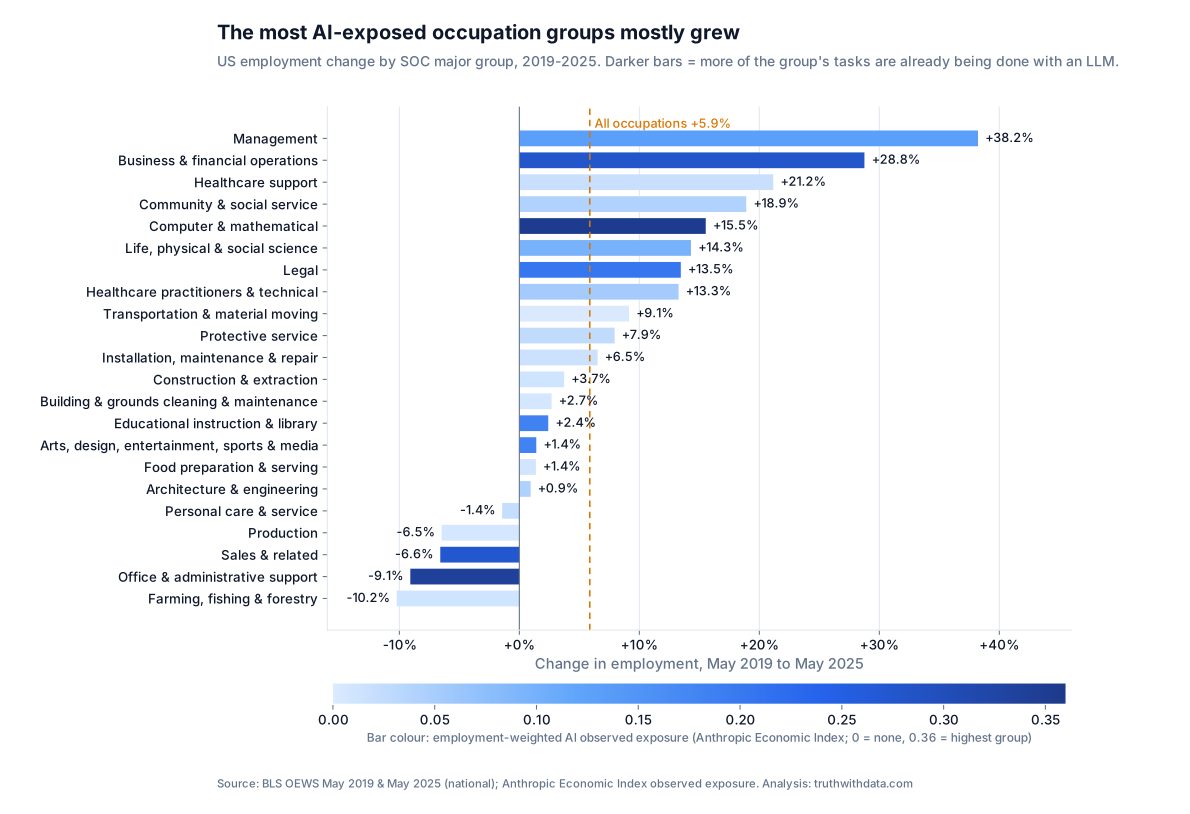
Three things stand out. First, the fastest-growing groups are management (+38.2%) and business and financial operations (+28.8%), and both are among the most exposed to AI. Second, the two exposed groups that shrank, office and administrative support (−9.1%) and sales (−6.6%), were already shrinking or flat before 2019: office support lost 10.6% of its jobs between 2015 and 2019. Third, the biggest loser is farming, fishing and forestry (−10.2%), which has almost no AI exposure at all. Across the 22 groups the rank correlation between exposure and growth is +0.19 (p = 0.38): if anything, more exposed groups grew slightly more.
Major groups hide a lot, though. To see displacement, if it exists, we need to go down to the occupation level.
3. How AI exposure is measured
We use two exposure measures, chosen because they answer different questions.
Observed exposure (Anthropic Economic Index). Anthropic classifies millions of anonymised Claude conversations and API calls against the roughly 18,000 task statements in the US Department of Labor's O*NET database, then asks, for each occupation, what share of its tasks show meaningful automated use in real work. This is the measure of "is AI actually doing this" rather than "could it". It is demanding: of the 17,998 task statements with a penetration score, 92.5% score zero, 7.5% score at least 0.5 and only 1.1% score 1.0. At the occupation level, 392 of our 722 occupations (54%) have an exposure of exactly zero, and the mean is 0.07. The highest scores belong to computer programmers (0.75), customer service representatives (0.70), data entry keyers (0.67), medical records specialists (0.67) and market research analysts (0.65).
Theoretical exposure (Felten, Raj and Seamans' AIOE). Published in 2021, before ChatGPT, this index links ten AI capabilities (image recognition, language modelling, translation and so on) to the 52 abilities O*NET says each occupation needs. It measures what AI could touch, was fixed before the current wave, and so cannot be contaminated by post-2022 usage. We use it as a check on the first measure.
The measure has a bias, and the bias matters
Observed exposure counts where Claude is used. Coding is one of Claude's heaviest uses, so computer occupations may be over-scored relative to, say, call-centre work automated with other vendors' models. We have no way to correct this, which is one reason we run every model twice, once with each measure.
4. The correlation
Figure 2 is the whole argument in one picture. Each bubble is an occupation, sized by its 2019 employment; the horizontal axis is observed AI exposure and the vertical axis is the annualised change in employment from May 2019 to May 2025. The line is an employment-weighted least-squares fit with its 95% confidence band.
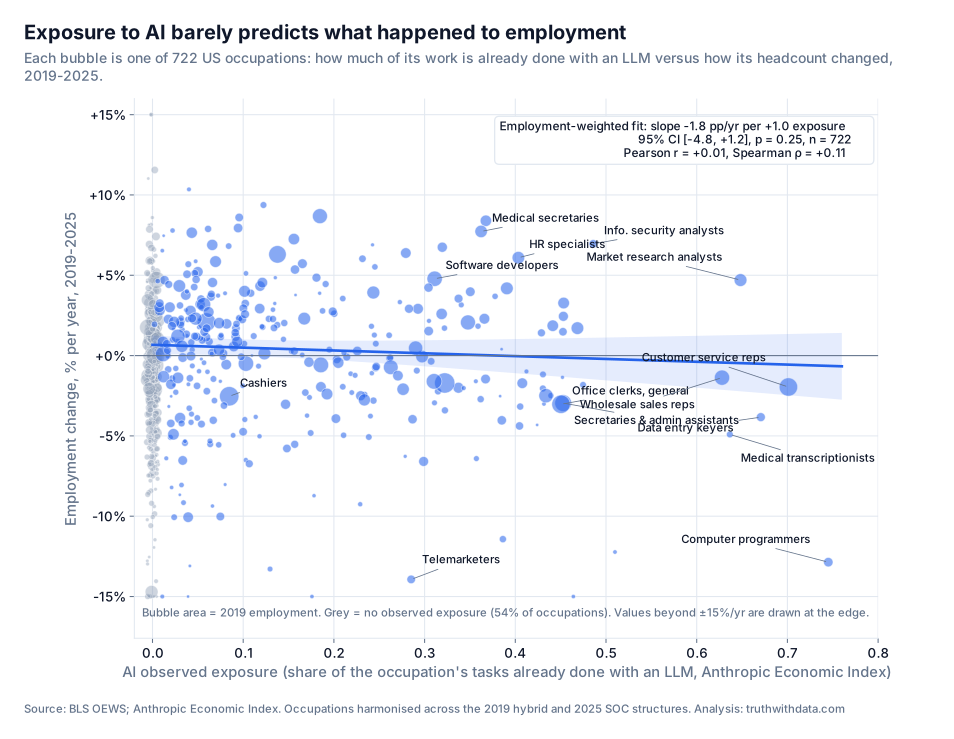
The numbers behind it:
Weighting by employment, so that customer service representatives count 2.9 million times and statistical assistants 9,800 times, produces a slightly negative slope; treating every occupation equally produces a slightly positive one. Neither is distinguishable from zero. Among the 330 occupations with non-zero exposure the picture is the same (r = −0.10, p = 0.08), and the top exposure quintile grew 0.3 points a year more slowly than the zero-exposure group, with a bootstrap 95% interval of −1.5 to +1.4. Knowing how exposed an occupation is to AI tells you almost nothing about what happened to its headcount.
5. Why the correlation is probably misleading
A near-zero raw correlation can still hide a real effect if exposed occupations differ from unexposed ones in ways that also drive employment. They do: exposed jobs are better paid, more often done remotely, and concentrated in white-collar families with their own post-pandemic and interest-rate stories. So we re-ran the regression with controls for log 2019 median wage, Dingel and Neiman's share of the occupation that can be done from home, and fixed effects for the 22 occupation families. Then we did what most articles on this topic never do: we ran the identical models on 2015–2019, when generative AI did not exist. If exposure "predicts" employment change in a period when it could not have caused it, the post-2019 relationship is a proxy for something else.
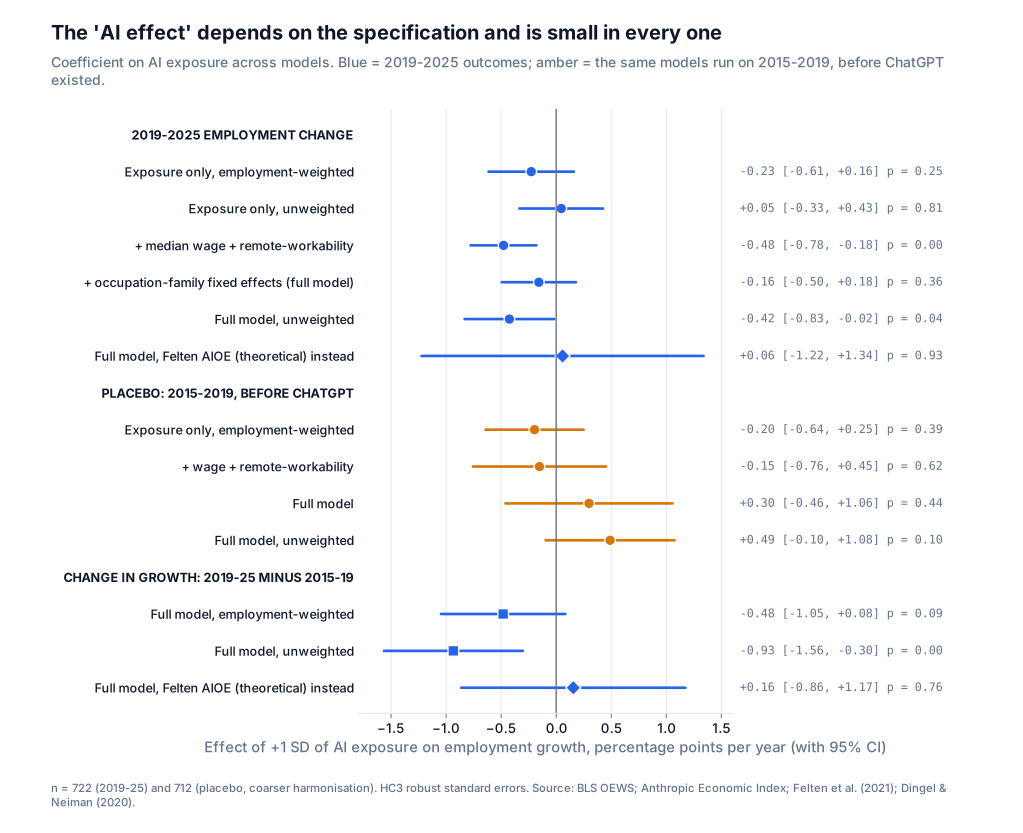
Three results from Figure 3 matter.
The one "significant" number does not survive. Adding wage and remote-work controls turns the slope into −0.48 points a year per standard deviation (95% CI −0.78 to −0.18, p = 0.002). This is the number a motivated author would lead with. It appears because higher-paid occupations grew faster over 2019–2025 (wage coefficient +1.8 points per log-point, p = 0.003) and exposure is correlated with pay. But add fixed effects for occupation family and it falls to −0.16 (CI −0.50 to +0.18, p = 0.36). The effect lives between families, office work versus computing versus healthcare, not between more and less exposed jobs within a family, and between-family differences are exactly where the pandemic, remote work and interest rates did their damage. Unweighted, the full model gives −0.42 (p = 0.04), shrinking to −0.39 (p = 0.054) after trimming the extreme 1% of outcomes; dropping the "All Other" catch-all codes gives −0.11 (p = 0.50).
The placebo reproduces the raw relationship. The employment-weighted bivariate slope was −0.20 in 2015–2019 and −0.23 in 2019–2025: whatever the raw tilt against exposed occupations is, it predates ChatGPT by years. With full controls the placebo coefficient is +0.30 (p = 0.44), unweighted +0.49 (p = 0.10): before the current wave, exposed occupations within a family were growing a little faster. That makes the post-2019 estimate of −0.16 look like a small deceleration rather than nothing, and it is the one thread worth pulling.
The change-in-growth test finds something, but it is small and fragile. The cleanest specification uses each occupation as its own control: the outcome is 2019–2025 growth minus 2015–2019 growth, so occupation-specific trends cancel out. Employment-weighted, one standard deviation of exposure is associated with a slowdown of 0.48 points a year (95% CI −1.05 to +0.08, p = 0.095). Unweighted it is −0.93 (CI −1.56 to −0.30, p = 0.004) and survives trimming (−0.72, p = 0.001). A clearer result when every occupation counts equally means the slowdown is concentrated in small exposed occupations, not the big ones that employ most people. And it is specific to observed exposure: the same model with Felten's theoretical measure gives +0.16 (p = 0.77) for the change in growth and +0.06 (p = 0.93) for the level. Where LLMs are actually used, growth slowed a little; where they merely could be used, nothing.
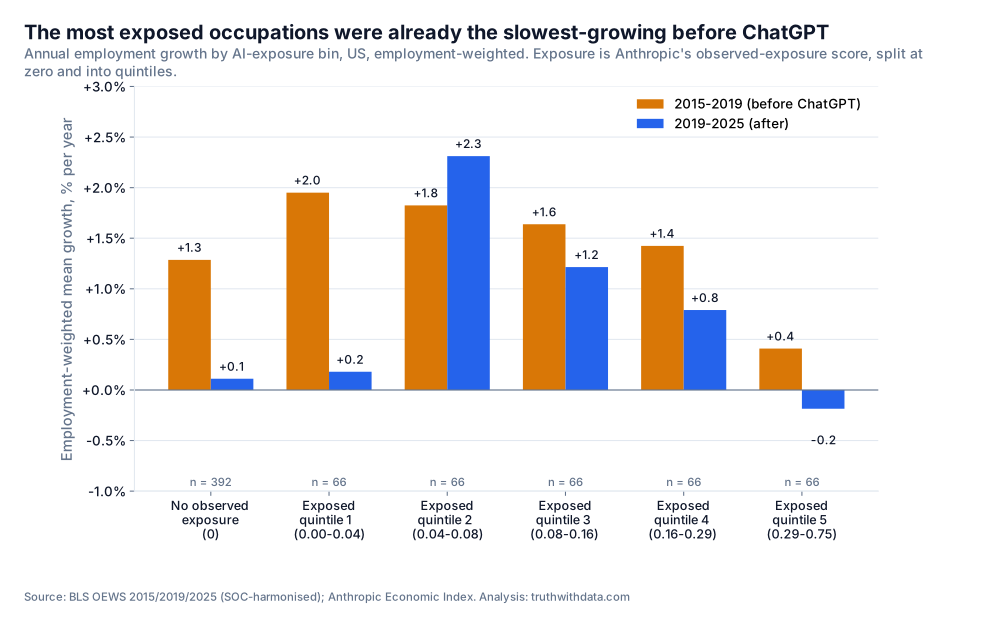
Figure 4 puts the magnitude in context. The most exposed fifth of occupations went from +0.4% a year to −0.2%. Occupations with no AI exposure went from +1.3% to +0.1%. Growth slowed nearly everywhere after 2019; the exposed occupations simply started from a lower base. Our best estimate of the AI-specific component is a slowdown of roughly half a point a year per standard deviation of exposure: statistically marginal, driven by small occupations, and small next to the churn of an economy that added 8.6 million jobs.
6. Where the effect is real
Averages can be flat while specific jobs are hollowed out. Figure 5 shows the 30 most exposed occupations with their growth before and after 2019. Of the 30, 21 shrank between 2019 and 2025, 25 grew more slowly than they had in 2015–2019, and 9 kept growing.
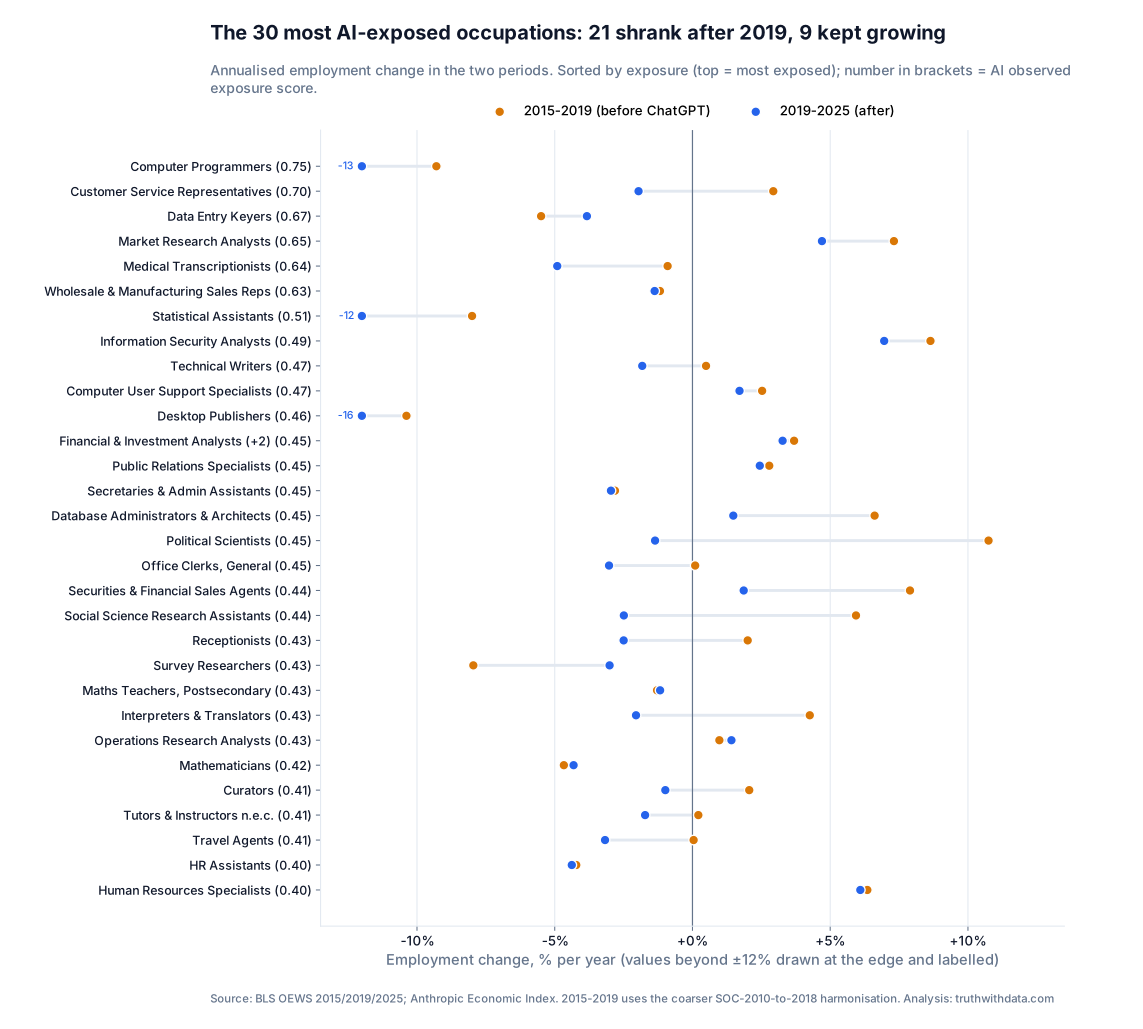
We sorted every occupation with an exposure score of 0.30 or more (63 occupations, 28.2 million jobs in 2019) into four groups, using two tests: did employment fall by more than 5%, and did growth slow relative to the occupation's own 2015–2019 trend?
| Pattern among occupations with exposure ≥ 0.30 | Occupations | Jobs in 2019 | Examples (exposure; change 2019–25; change 2015–19) |
|---|---|---|---|
| Shrank, and growth slowed after 2019 | 29 | 18.1m | Customer service reps (0.70; −11%; +13%), office clerks (0.45; −17%; +0.4%), receptionists (0.43; −14%; +8%), retail salespersons (0.32; −10%; −6%), bookkeeping clerks (0.31; −9%; −4%), medical transcriptionists (0.64; −26%; −4%), technical writers (0.47; −10%; +2%), interpreters & translators (0.43; −12%; +19%), graphic designers (0.37; −8%; +5%) |
| Shrank, but was already shrinking before ChatGPT | 6 | 0.3m | Data entry keyers (0.67; −20%; −20%), survey researchers (0.43; −17%; −27%), mathematicians (0.42; −23%; −17%) |
| Grew faster than the economy (+5.9%) | 26 | 9.7m | Market research analysts (0.65; +33%; +34%), information security analysts (0.49; +52%; +41%), HR specialists (0.40; +44%; +29%), financial managers (0.39; +28%; +23%), software developers (0.31; +33%; +30%), accountants (0.35; +13%; +4%) |
| Roughly flat | 2 | 0.1m | Astronomers (0.38; +2%), postsecondary business teachers (0.31; −2%) |
The first row is where a displacement story is defensible. Customer service representatives are the single most important case: 2.9 million jobs in 2019, 2.6 million in 2025, a swing from +12.5% in the previous four years to −11%. Anthropic's own reports note that customer-support workflows are among the most common automated uses of its API, and the timing fits. Office clerks (−491,000 jobs) and receptionists (−147,000) follow the same shape, as do several small knowledge occupations: technical writers, interpreters, social science research assistants and graphic designers.
Computer programmers are the most dramatic decline on the list, from 199,540 to 92,230 (−54%), but also the clearest example of why timing matters: the occupation had already shrunk 31% between 2015 and 2019 as the same work was increasingly titled "software developer". Software developers, the larger occupation doing most of the economy's coding, grew 33% over 2019–2025, almost exactly their pre-ChatGPT rate. The 29 occupations that shrank and slowed employed 18.1 million people in 2019, but more than half of that is three occupations, retail salespersons, general office clerks and customer service representatives, and retail salespersons (exposure 0.32) were already losing jobs before ChatGPT.
Consistent with, not proof of
Customer service, clerical and reception work were also hit by pandemic-era automation of a different kind (self-service portals, chat scripts, appointment apps) and by the 2022–2024 rate rises that ended the hiring boom. An occupation that shrank and slowed and has high exposure passes our screen; it does not pass a causal test, because no comparison group experienced the same shocks without the AI.
7. The UK picture
We could not repeat the occupation-level analysis for the UK, and it is worth being explicit about why. The exposure scores are built on US SOC 2018 codes and O*NET tasks. The UK uses SOC 2020, a different classification; the only route between them runs through the international ISCO-08 standard, losing detail at each step, and the ONS's own methodology notes warn that the move from SOC 2010 to SOC 2020 created discontinuities in occupational series. The ONS files we used contain the SOC 2020 correspondence tables but no occupation-by-year employment counts, so the UK check is at industry level, using a theoretical exposure measure (Felten's industry index mapped from NAICS to SIC sections).
Vacancies by industry. ONS VACS02 shows UK vacancies averaging 827,000 in 2019, peaking at 1.24 million in 2022, and averaging 720,000 over the twelve rolling quarters to June–August 2026: down 42% from the peak and 13% below 2019. All 18 industry sections fell from 2022, and the most AI-exposed fell less than average: financial and insurance −37%, professional, scientific and technical −41%, information and communication −47%, against −55% for accommodation and food. The rank correlation between industry exposure and the 2022–2026 change in vacancies is +0.26 (p = 0.32, n = 16), the wrong sign for a displacement story and, with 16 data points, not something to lean on either way.
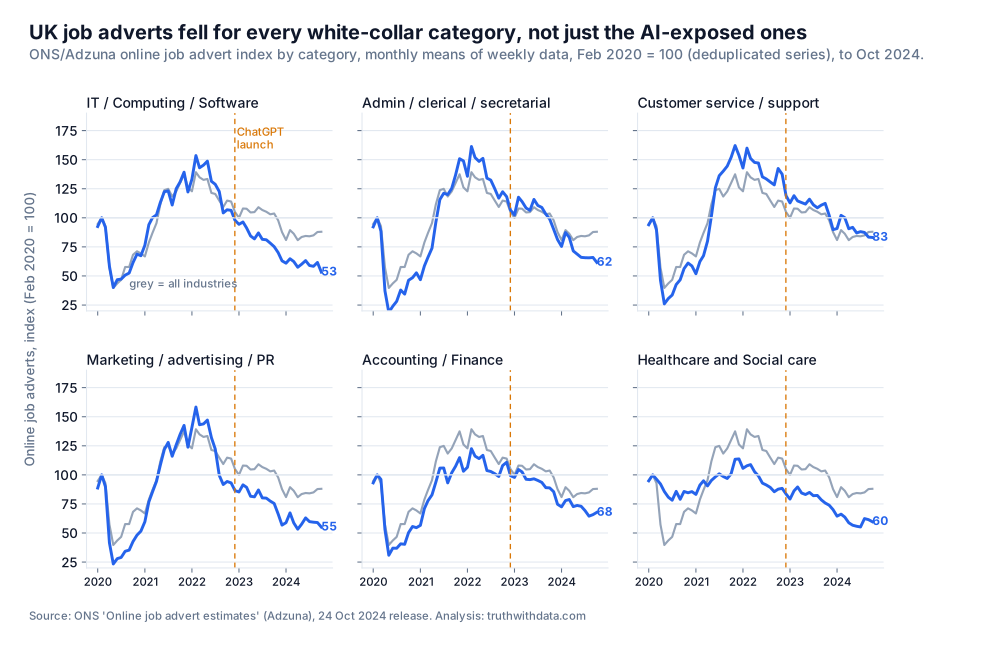
Online job adverts. The ONS/Adzuna series runs to October 2024, indexed to February 2020. It shows a steep post-2022 fall in adverts for IT and computing (to 53), marketing (55), admin and clerical (62) and accounting and finance (68), against 88 for all industries. That looks like an AI signature until you notice healthcare and social care at 60, a category with almost no LLM exposure. UK white-collar hiring collapsed across the board after the 2022 peak; the exposed categories are in the collapse, not singled out by it. One more inconvenient fact from Indeed: UK advertised wages were still growing 4.0% year-on-year in July 2026, faster than the US (2.5%), not what a labour market shedding workers to automation usually looks like.
8. What this means if it's your job
Three practical readings follow from the numbers.
Exposure is not a forecast. Occupations in the top exposure fifth had a 58% chance of shrinking between 2019 and 2025; occupations with zero exposure, 57%. The base rate of "my occupation got smaller" over a six-year window is high everywhere, and AI exposure barely moves it. What exposure does predict is which tasks in your week will change, a question about your job description, not your employment.
The pattern that should worry you is specific. High exposure, employment already falling, and a deceleration after 2019 that the occupation's own history cannot explain. Customer service representatives, receptionists, general office clerks, medical transcriptionists and technical writers fit it. If your work is mostly the routine text-handling part of one of those occupations, the last three years of data are on the pessimists' side.
Exposed and growing is the most common outcome among knowledge jobs. Software developers, market research analysts, HR specialists, financial analysts, accountants and paralegals (exposure 0.29, +19%) all show heavy LLM use of their tasks and rising headcounts. That is consistent with the technology raising the value of the people who use it while demand for their output keeps growing. It does not guarantee the next six years look like the last six; nothing in observational data can.
Check your own occupation
Our free AI Job Exposure Checker looks up any of 787 US occupations (and about 3,000 alternative job titles) and shows its exposure score, its 2019–2025 employment change, its pre-ChatGPT trend, and what happened to occupations with similar exposure. It runs entirely in your browser.
9. Methodology, limitations and reproducibility
Data
Employment: BLS OEWS national files, May 2015, 2019 and 2025, detailed occupations. Observed exposure: Anthropic Economic Index job_exposure.csv (756 SOC 2018 occupations) and task_penetration.csv (17,998 O*NET tasks). Theoretical exposure: Felten, Raj and Seamans (2021) AIOE by occupation and AIIE by industry. Remote-workability: Dingel and Neiman (2020). Crosswalk: BLS SOC 2010 to 2018 (November 2017). UK: ONS VACS02 (September 2026), ONS/Adzuna online job adverts (24 October 2024), ONS SOC 2020 methodology tables. Wages: Indeed Hiring Lab posted wage growth, to July 2026.
Harmonising occupations
The three OEWS files use three code structures: SOC 2010 in 2015, a BLS "hybrid" in 2019, and SOC 2018 in 2025. Comparing codes naively would count every reclassification as a job gain or loss. We built harmonised groups as connected components of a graph whose edges link (a) the 42 OEWS aggregate codes to the detailed codes they contain and (b) for the placebo only, every SOC 2010 to 2018 crosswalk link; employment is summed within a group in every year. The fine harmonisation (2019 and 2025) yields 787 groups, of which 729 have an exposure score and 722 also a wage, covering 92% of 2019 employment. The coarse harmonisation, which also carries 2015, yields 775 groups (712 in the placebo sample); its largest component chains twelve computer and management codes through Project Management Specialists, carved out of three different 2010 codes. One manual link combines Data Scientists with Computer Occupations, All Other, because the 2019 hybrid file coded most data scientists under the latter (30,810 jobs against 266,160 in 2025). Group exposure is the 2025-employment-weighted mean of member scores.
Estimation
The outcome is the annualised change in log employment, (ln E2025 − ln E2019)/6, and analogously for 2015–2019. Exposure enters standardised (population SD = 0.129) so the two measures are comparable. Headline models are weighted least squares with 2019 employment weights; unweighted versions are reported throughout. Standard errors are HC3-robust. Controls: log 2019 median annual wage (hourly-only occupations converted at 2,080 hours), teleworkability, and 22 major-group fixed effects. The change-in-growth outcome is the 2019–25 rate minus the 2015–19 rate. Occupations without an AIOE score are dropped from AIOE models. Bootstrap intervals use 4,000 resamples with a fixed seed. The Python (statsmodels) and R (sandwich/lmtest) implementations agree on every coefficient to four decimal places.
Limitations
- The window is contaminated. 2019–2025 contains the pandemic, the 2021–22 hiring surge, the 2022–24 rate rises and the 2022 change in US tax treatment of software R&D. The placebo and change-in-growth designs address occupation-specific trends, not shocks that hit exposed families in this window. May 2022–2024 OEWS files would let us isolate the post-ChatGPT period.
- OEWS is a survey of establishments. It excludes the self-employed (freelance writers, translators and designers, some of the most exposed workers) and measures jobs, not hours or hiring. A freeze on graduate hiring would appear only slowly.
- Exposure covers 92% of employment. Home health and personal care aides (4.3 million), teaching assistants, miscellaneous assemblers and some sales occupations have no score. These are low-exposure jobs, so their absence more likely mutes than exaggerates any relationship.
- Industry is proxied by occupation family. A true industry control needs the OEWS industry files; major-group fixed effects absorb family-level shocks but not, say, a retail downturn that hit cashiers and stock clerks alike.
- May 2025 is early. Agentic tools and API automation scaled through 2025 and 2026. Everything here describes the first two and a half years after ChatGPT, not the steady state.
Reproduce the headline in a few lines
Download the cleaned dataset (ai-exposure-employment-change-by-occupation.csv, 787 rows) and the coarse 2015–2025 panel used for the placebo (coarse panel CSV). The snippets below reproduce the correlations, the bivariate weighted model and the full model. The complete pipeline, from the raw BLS, Anthropic, Felten and Dingel–Neiman files to every specification, the UK supplement and the charts, is in the code bundle: 01_build_panel.py, 02_analysis.py, 03_uk_supplement.py, 04_charts.py, 05_export.py and analysis.R.
# pip install pandas numpy scipy statsmodels
import numpy as np, pandas as pd
import statsmodels.formula.api as smf
from scipy import stats

df = pd.read_csv("ai-exposure-employment-change-by-occupation.csv", dtype={"major_group": str})
df = df.dropna(subset=["aei_observed_exposure", "median_annual_wage_2019"]).copy()   # 722 occupations

# Outcome: annualised change in log employment, in percentage points per year
df["y"] = df["annualised_log_change_2019_2025"] * 100
# Exposure standardised to 1 SD (population SD), plus controls
x = df["aei_observed_exposure"]
df["exposure_sd"] = (x - x.mean()) / x.std(ddof=0)
df["log_wage"] = np.log(df["median_annual_wage_2019"])
df["tele"] = df["dingel_neiman_teleworkable"].fillna(df["dingel_neiman_teleworkable"].mean())

print("Pearson r:",  stats.pearsonr(x, df["y"]))        # r = +0.01, p = 0.79
print("Spearman:",   stats.spearmanr(x, df["y"]))       # rho = +0.11, p = 0.004

w = df["employment_may2019"]
m1 = smf.wls("y ~ exposure_sd", df, weights=w).fit(cov_type="HC3")
m4 = smf.wls("y ~ exposure_sd + log_wage + tele + C(major_group)", df, weights=w).fit(cov_type="HC3")
for name, m in [("bivariate, weighted", m1), ("full model", m4)]:
    lo, hi = m.conf_int().loc["exposure_sd"]
    print(f"{name}: {m.params['exposure_sd']:+.2f} pp/yr per SD  [{lo:+.2f}, {hi:+.2f}]  p = {m.pvalues['exposure_sd']:.3f}")
# bivariate: -0.23 [-0.61, +0.16] p = 0.251 ; full model: -0.16 [-0.50, +0.18] p = 0.360# install.packages(c("sandwich", "lmtest"))
library(sandwich); library(lmtest)
df <- read.csv("ai-exposure-employment-change-by-occupation.csv", colClasses = c(major_group = "character"))
df <- df[!is.na(df$aei_observed_exposure) & !is.na(df$median_annual_wage_2019), ] # 722 occupations
df$y <- df$annualised_log_change_2019_2025 * 100 # pp per year
x <- df$aei_observed_exposure
df$exposure_sd <- (x - mean(x)) / sqrt(mean((x - mean(x))^2)) # population SD, as in Python
df$log_wage <- log(df$median_annual_wage_2019)
df$tele <- ifelse(is.na(df$dingel_neiman_teleworkable), mean(df$dingel_neiman_teleworkable, na.rm = TRUE), df$dingel_neiman_teleworkable)
cor.test(x, df$y) # r = +0.01, p = 0.79
cor.test(x, df$y, method = "spearman", exact = FALSE) # rho = +0.11, p = 0.004
report <- function(m, name) {
ct <- coeftest(m, vcov = vcovHC(m, type = "HC3")); ci <- coefci(m, vcov = vcovHC(m, type = "HC3"))
cat(sprintf("%s: %+.2f pp/yr per SD [%+.2f, %+.2f] p = %.3f\n", name,
ct["exposure_sd", 1], ci["exposure_sd", 1], ci["exposure_sd", 2], ct["exposure_sd", 4]))
}
report(lm(y ~ exposure_sd, df, weights = employment_may2019), "bivariate, weighted")
report(lm(y ~ exposure_sd + log_wage + tele + factor(major_group), df, weights = employment_may2019), "full model")
# bivariate: -0.23 [-0.61, +0.16] p = 0.252 ; full model: -0.16 [-0.50, +0.18] p = 0.360Conclusion: is AI replacing jobs?
No, not measurably, as of May 2025. Across 722 US occupations the correlation between how much of a job's work is already done with an LLM and how its headcount changed is 0.01. The one specification that produces a headline-sized negative effect disappears once you compare occupations within the same family, and the raw tilt against exposed occupations is the same size in 2015–2019 as after ChatGPT. The most exposed groups in the economy, business and finance and computing, added jobs faster than almost anyone else.
But "no" has a footnote. Exposed occupations slowed relative to their own pre-2019 trend by about half a percentage point a year per standard deviation of exposure: marginal when weighted by employment, clearer among small occupations, absent when exposure is measured by capability rather than use. And a specific list of jobs, customer service representatives, general office clerks, receptionists, medical transcriptionists, technical writers, interpreters and graphic designers, shrank after 2019 in a way their own history does not explain. If AI is displacing anyone at scale in this data, it is them, and the total is on the order of a million jobs against a labour market that grew by 8.6 million.
Key takeaways
AI exposure explains about 1% of the variation in US occupational employment change, 2019–2025. The relationship is not new, not robust to controls, and small in every specification. Displacement is real but narrow: a handful of clerical and support occupations. Most exposed knowledge jobs grew. Check any occupation with the AI Job Exposure Checker.
Frequently asked questions
Which jobs are most likely to be replaced by AI?
On Anthropic's observed-exposure measure the most exposed US occupations are computer programmers (75% of tasks show LLM use), customer service representatives (70%), data entry keyers (67%), medical records specialists (67%) and market research analysts (65%). But exposure is not replacement: market research analysts grew 33% between 2019 and 2025 and software developers grew 33%, while computer programmers fell 54%, a decline that was already 31% in the four years before ChatGPT.
Is AI actually causing job losses right now?
Not measurably at the level of whole occupations, as of May 2025. Across 722 US occupations the correlation between AI exposure and employment change from 2019 to 2025 is r = 0.01 (p = 0.79), and the same relationship existed before ChatGPT. The one robust signal is a small slowdown in growth among smaller exposed clerical and support occupations, about half a percentage point a year per standard deviation of exposure.
How many jobs has AI replaced so far?
There is no reliable count. Occupations with high AI exposure (score of 0.30 or more) employed 28.2 million Americans in 2019 and 28.6 million in 2025, up 1.2%, versus 5.9% for all occupations. The gap is about 1.3 million jobs, but occupations with zero exposure also under-performed the economy (+2.2%), so most of the gap cannot be attributed to AI.
What jobs are safe from AI?
More than half of US occupations (392 of 722) show no observed LLM use at all, mostly physical, care and trade jobs: nurses, electricians, drivers, cooks, construction workers. But zero exposure did not mean growth: 57% of those occupations also shrank between 2019 and 2025, the same share as among the most exposed. Safety from AI and job security are different things.
Will AI replace software developers?
Software developers are among the most AI-exposed occupations (31% of tasks show LLM use), yet US employment of software developers rose 33% between May 2019 and May 2025, close to its pre-ChatGPT growth rate of 30%. The related but much smaller occupation of computer programmers fell 54%, continuing a decline that began years earlier as the same work was reclassified.
Sources and data statement
- Anthropic. Anthropic Economic Index:
job_exposure.csvandtask_penetration.csv, Hugging Face dataset Anthropic/EconomicIndex, CC BY 4.0. Method described in "Labor market impacts of AI: a new measure" and the March 2026 and June 2026 Economic Index reports. - US Bureau of Labor Statistics. Occupational Employment and Wage Statistics, national files for May 2015, May 2019 and May 2025 (
oesm15nat,oesm19nat,oesm25nat). bls.gov/oes. Employment estimates are subject to sampling error; OEWS is not designed as a time series and BLS advises caution when comparing years. - US Bureau of Labor Statistics, on behalf of OMB and the SOC Policy Committee. 2010 SOC to 2018 SOC crosswalk, November 2017. bls.gov/soc.
- Felten, E., Raj, M. and Seamans, R. (2021). "Occupational, industry, and geographic exposure to artificial intelligence: A novel dataset and its potential uses." Strategic Management Journal, 42(12), 2195–2217. doi:10.1002/smj.3286. Data: github.com/AIOE-Data/AIOE.
- Dingel, J. I. and Neiman, B. (2020). "How many jobs can be done at home?" Journal of Public Economics, 189, 104235. Data: github.com/jdingel/DingelNeiman-workathome.
- National Center for O*NET Development. O*NET 31.0 Database: Task Statements and Sample of Reported Titles. onetcenter.org. CC BY 4.0.
- Office for National Statistics. VACS02: Vacancies by industry, September 2026 release; Online job advert estimates (Adzuna), 24 October 2024 release; SOC 2020 Volume 1 methodology tables. ons.gov.uk. Contains public sector information licensed under the Open Government Licence v3.0.
- Indeed Hiring Lab. Posted wage growth by country and by US sector, data to July 2026. github.com/hiring-lab.
Data statement. All figures in this article were computed by the author from the sources above between 15 and 17 September 2026; no statistic is quoted from a secondary source. The cleaned datasets (occupation panel, coarse 2015–2025 panel) are released under CC BY 4.0 and may be reused with attribution to Truth with Data and to the original data providers. Employment counts are BLS estimates with sampling error; exposure scores are Anthropic's and reflect usage of Claude specifically. Derived classifications ("shrank and slowed", exposure bands) are the author's. Nothing here is careers, financial or legal advice. Corrections are welcome at the contact address on the home page; material corrections will be noted on this page with a date.
Working on a question your organisation needs answered with data rather than opinion? Our data consultancy services cover exactly this kind of analysis, from data sourcing to publication-ready charts. Or explore our free statistical calculators.