01The question
Headlines about AI and jobs usually rest on one of two things: studies of which tasks AI could do, or companies mentioning AI in a layoff announcement. Neither counts jobs.
We asked the question directly: did occupations where AI is actually being used lose employment after generative AI arrived, compared with occupations where it is not? And we committed in advance to publishing the answer whichever way it came out.
02The approach
Measure real use, not potential
We used the Anthropic Economic Index, which maps millions of real AI conversations to the roughly 18,000 tasks in the US occupational database, and kept a pre-ChatGPT theoretical index as a cross-check.
Link three datasets that do not line up
Occupation codes changed between 2015, 2019 and 2025. We built a crosswalk that merges codes only where they split or combined, keeping 722 occupations and 92% of employment.
Control for the obvious confounders
Pay level, how much of a job can be done from home, and fixed effects for 22 occupation families, with employment weights and robust standard errors.
Run the placebo
The identical models on 2015–2019, before generative AI. If exposure “predicts” job change then too, the post-2019 relationship cannot be caused by AI.
Look where the effect could hide
A change-in-growth design (did growth slow compared with each occupation's own trend?), unweighted versions, and the individual occupations most exposed to AI.
03What we found
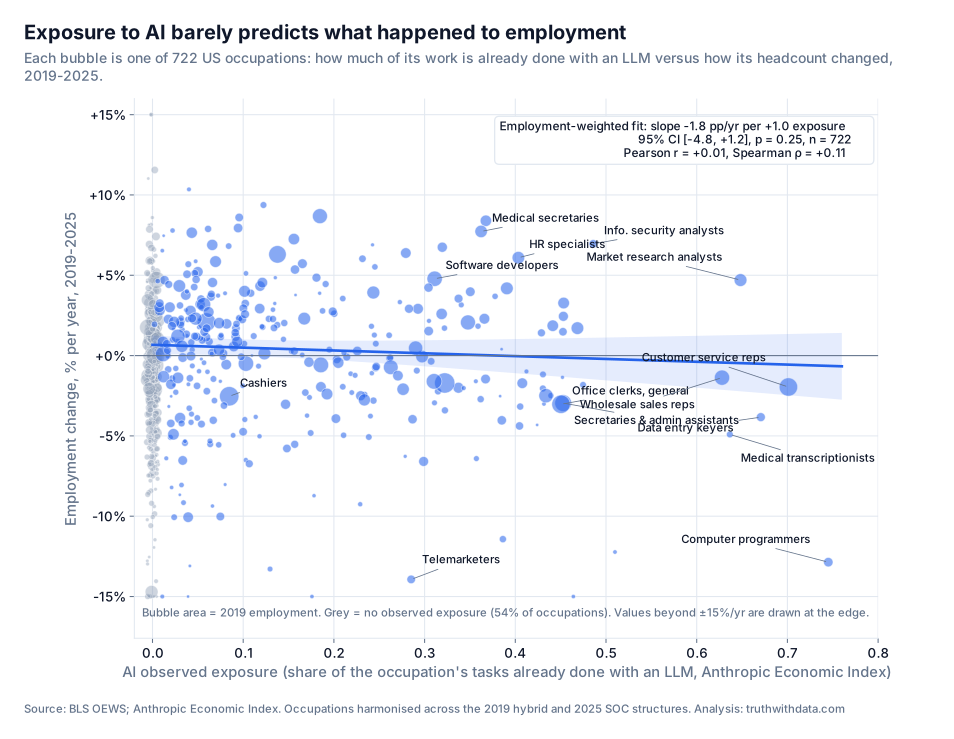
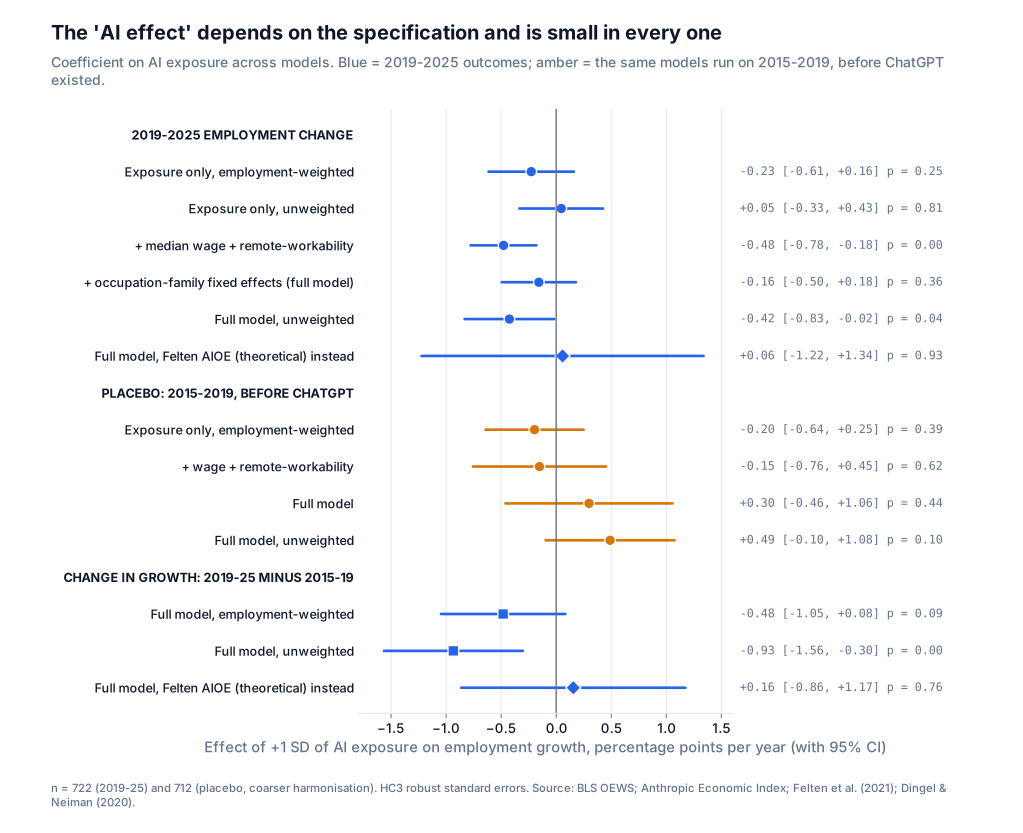
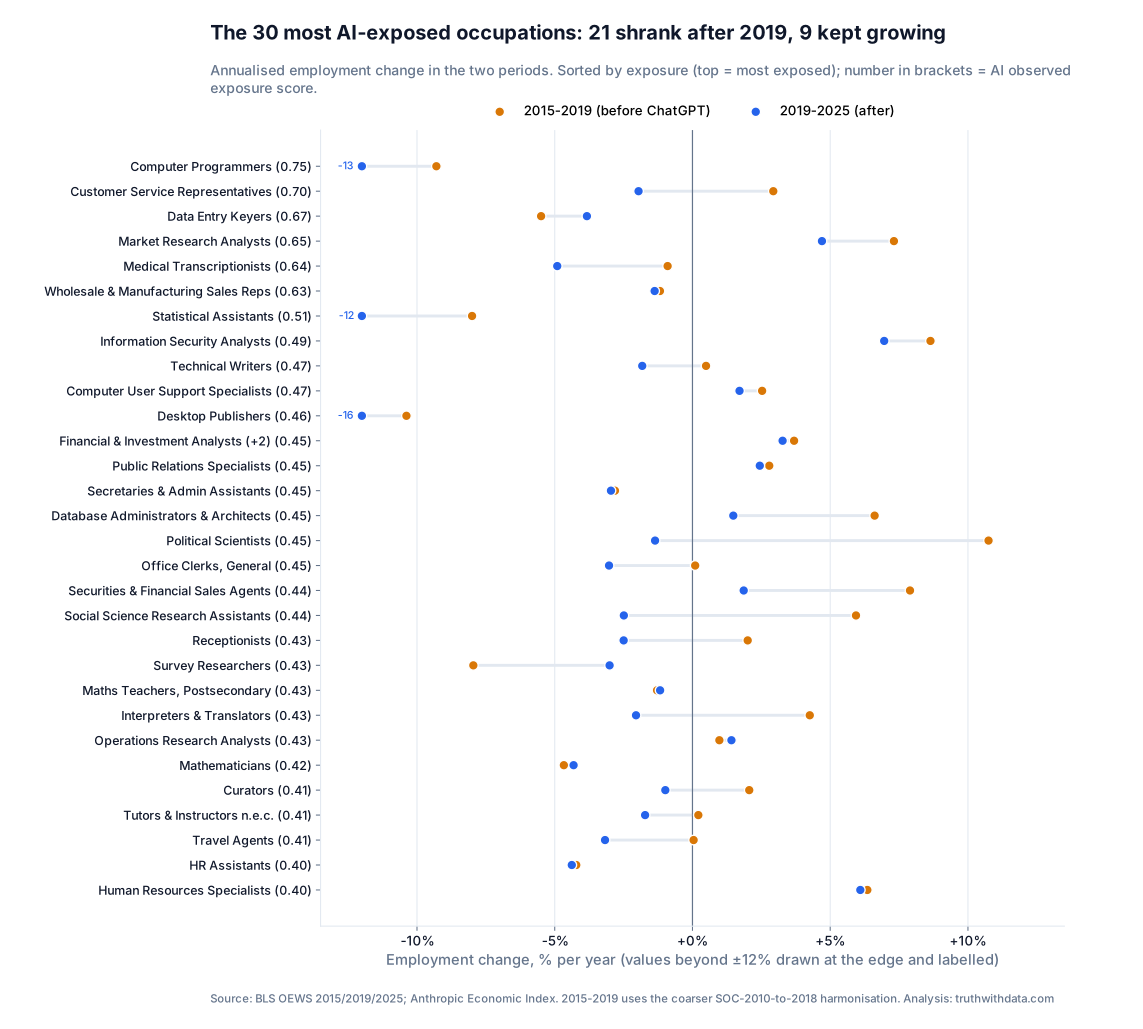
A naive analysis finds an “AI effect”. A careful one shows most of it is something else, and points to the handful of jobs where the effect is real.
04Why this matters
Workforce planning
Which of your roles are actually being reshaped, and which are only theoretically exposed? The difference changes hiring and training budgets.
Marketing and pricing
Did the campaign or the price change cause the uplift, or was the trend already there? The placebo test answers that in one model run.
Policy and investment
Before backing a programme or a sector thesis, check whether the relationship survives controls and a pre-period.
Messy data linkage
Codes that change over time, partial coverage and mismatched units are the normal state of real data. Getting the joins right is most of the work.
05Limits
What this can and cannot show
- It counts wage-and-salary jobs, not hours, hiring or the self-employed, so a freeze on graduate hiring would show up only slowly.
- The data ends in May 2025, two and a half years after ChatGPT's launch. Effects may still be building.
- The exposure measure reflects use of one AI system. Occupation-level data cannot show what happens inside firms.
06How we would do this for you
State the claim
Write down the causal question, the comparison group and the placebo before looking at results.
Link and model
Join your data to the external sources it needs, then run the main models, controls and pre-period tests.
Report the answer
A plain-English report that says what the data supports, what it does not, and what to watch next.
07Reproduce it
Data: US Bureau of Labor Statistics, Occupational Employment and Wage Statistics; Anthropic Economic Index; Felten, Raj and Seamans (2021) AI Occupational Exposure; Dingel and Neiman (2020) teleworkability.
This is an independent project built on public data to show how we work. It is not client work, and no client data was used. Figures are reproducible from the published code.