01The question
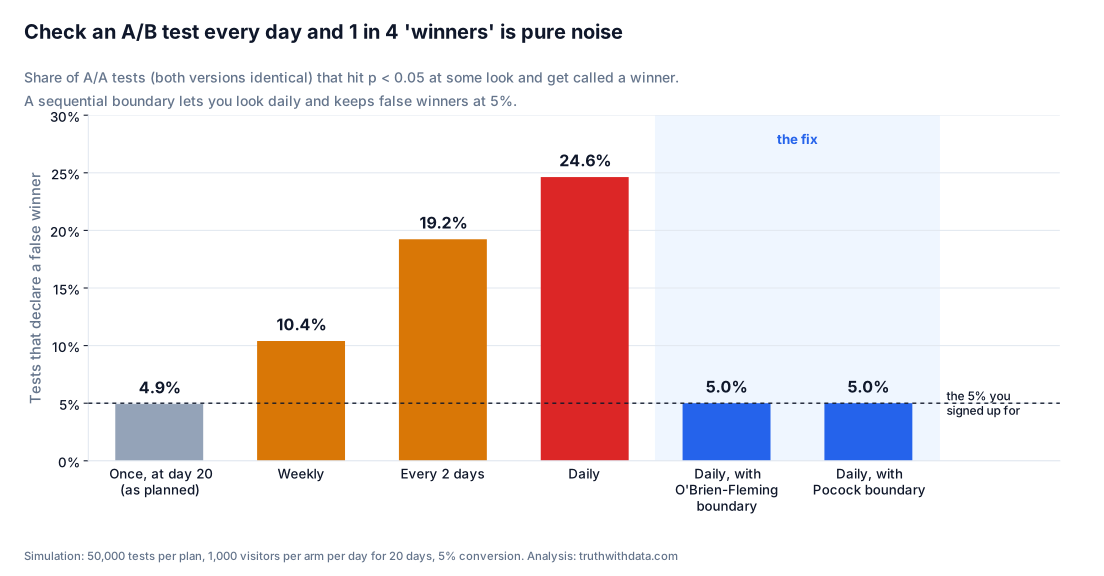
A p-value threshold of 0.05 promises that, if a change does nothing, you will wrongly call it a winner only 5% of the time. That promise holds only if you look once, at the sample size you planned.
In practice dashboards update live, stakeholders ask for early reads, and tests get stopped the moment they hit significance. We wanted to put a number on what that habit costs, and show a fix that still lets teams look whenever they like.
02The approach
Simulate tests where nothing changed
A/A tests: both versions convert at exactly 5%, 1,000 visitors each per day for 20 days. Any “winner” is a false one.
Simulate tests where something did
A/B tests with a real 10% relative lift (5.0% to 5.5%), to measure power and how quickly each plan calls a true winner.
Compare six stopping plans
Look once at day 20, weekly, every two days, daily, and daily with two sequential boundaries. The same 50,000 A/A and 50,000 A/B tests are read under every plan.
Calibrate the fix by simulation
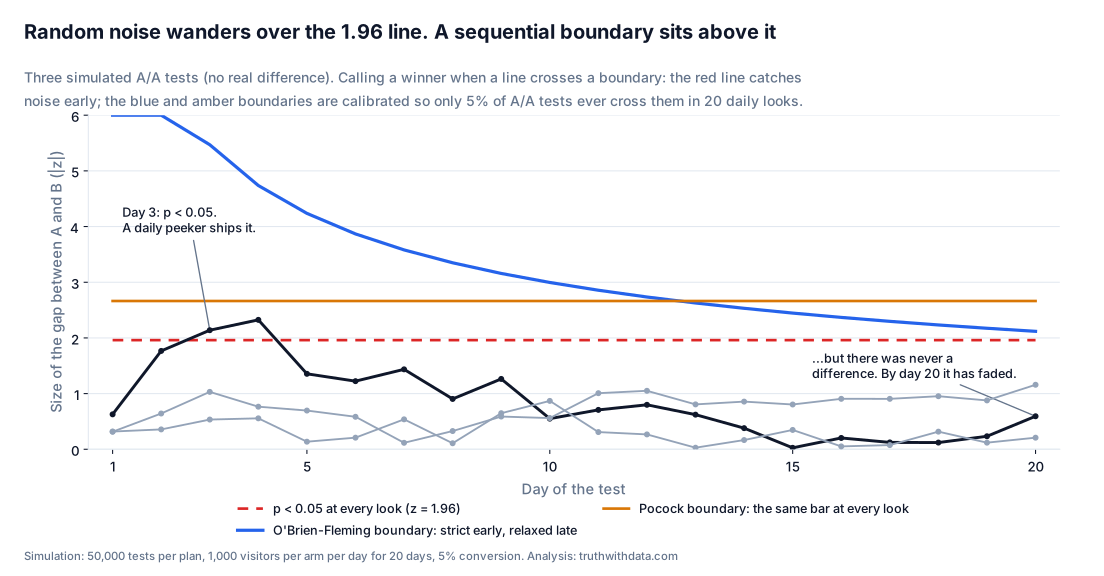
We tuned Pocock (the same bar at every look) and O'Brien-Fleming (strict early, relaxed late) boundaries so exactly 5% of A/A tests ever cross them in 20 daily looks.
03What we found
| Plan | False winners | Power (real 10% lift) | Average days to stop |
|---|---|---|---|
| Look once at day 20 | 4.9% | 61% | 20.0 |
| Look daily, stop at p < 0.05 | 24.6% | 74% | 11.0 |
| Daily with O'Brien-Fleming boundary | 5.0% | 59% | 16.8 |
| Daily with Pocock boundary | 5.0% | 46% | 15.8 |
Daily peeking looks more “powerful” only because it calls more of everything, including five times as many false winners. The O'Brien-Fleming boundary keeps the error rate honest, gives up just two points of power, and stops tests with a real effect 3.2 days sooner on average.
You can look at your experiments every day. You just need a stopping rule designed for it.
04What it means for your team
Fewer phantom wins
A team running 40 tests a year in which nothing really works would ship about 10 false winners with daily peeking, and about 2 with a sequential boundary.
Faster real decisions
Real winners are called days earlier on average, so traffic moves on to the next idea sooner.
Results people trust
When product, marketing and finance agree on the stopping rule up front, nobody argues about early reads.
Audit the past
Re-analysing completed tests with the right boundary shows which past "wins" were probably noise.
05Limits
Simplifications
- Traffic and conversion are constant from day to day. Real tests have weekday cycles and novelty effects, which make early looks even less reliable.
- One metric and two arms. Several metrics or variants raise the false-winner rate further unless corrected.
- The exact numbers depend on traffic, baseline rate and lift; the code lets you rerun them for yours.
06How we would do this for you
Audit
Review how tests are designed, monitored and stopped, and re-analyse a sample of past results.
Design
Sample sizes, a sequential stopping rule calibrated to your traffic, and guardrail metrics.
Embed
A test-readout template or dashboard that applies the rule automatically, and a session with your team.
07Reproduce it
The simulation runs in about three seconds and takes your own traffic, baseline and lift as parameters.
This is an independent project built on public data to show how we work. It is not client work, and no client data was used. Figures are reproducible from the published code.