01The question
“Renting is dead money” is one of the most repeated pieces of financial advice in the world. It is half right: rent buys you nothing you can sell. But most early mortgage payments are interest, and buying costs, repairs and insurance are just as unrecoverable.
The honest question is which set of unrecoverable costs is smaller, for the same home, over the time you will live in it. It is a decision worth hundreds of thousands, usually made on a rule of thumb. We used the UK as the test market because it publishes matched price and rent data for every local area. The same model works anywhere with house prices, rents and mortgage rates.
02The approach
One home, two households
One household buys the home. The other rents the same home and invests the deposit and buying costs. Each month, whoever pays less for housing invests the difference, so both spend exactly the same.
Every cost, month by month
Stamp duty, legal fees, survey, mortgage fees on every re-fix, maintenance, insurance, service charges, and the cost of selling at the end. Capital repayment counts as saving, not as a cost.
A break-even that means something
We report the month from which the buyer stays ahead for good, not the first time they pull ahead, so a brief lead before a re-fix fee or a price dip does not count.
Backtest against history
We replayed every purchase year from 2005 with the prices, rents and mortgage rates that actually followed, including the 2008 crash and the 2022 rate shock.
Stress the assumptions
Grids of mortgage rates (3–7%) against house-price growth (0–5%), deposits of 10% and 25%, and four property types.
Check it twice, then ship it
An independent R implementation reproduces all 120 region × property type × deposit results to the month. The calculator's JavaScript was checked against the same 120 cases.
03What we found
Mortgage interest alone is 77% to 107% of the rent on the same home in the first year. Add maintenance, insurance and the return the deposit could have earned, and owning costs 105% to 145% of the rent in every region. Whether buying wins depends almost entirely on what house prices do next.
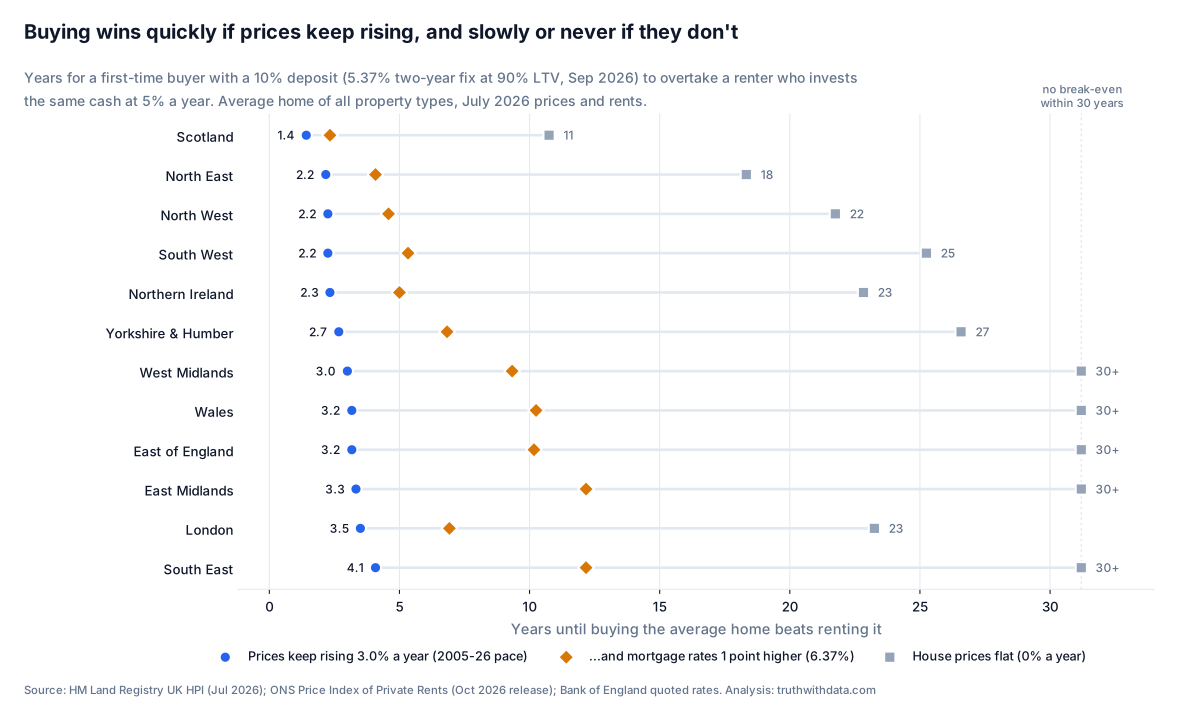
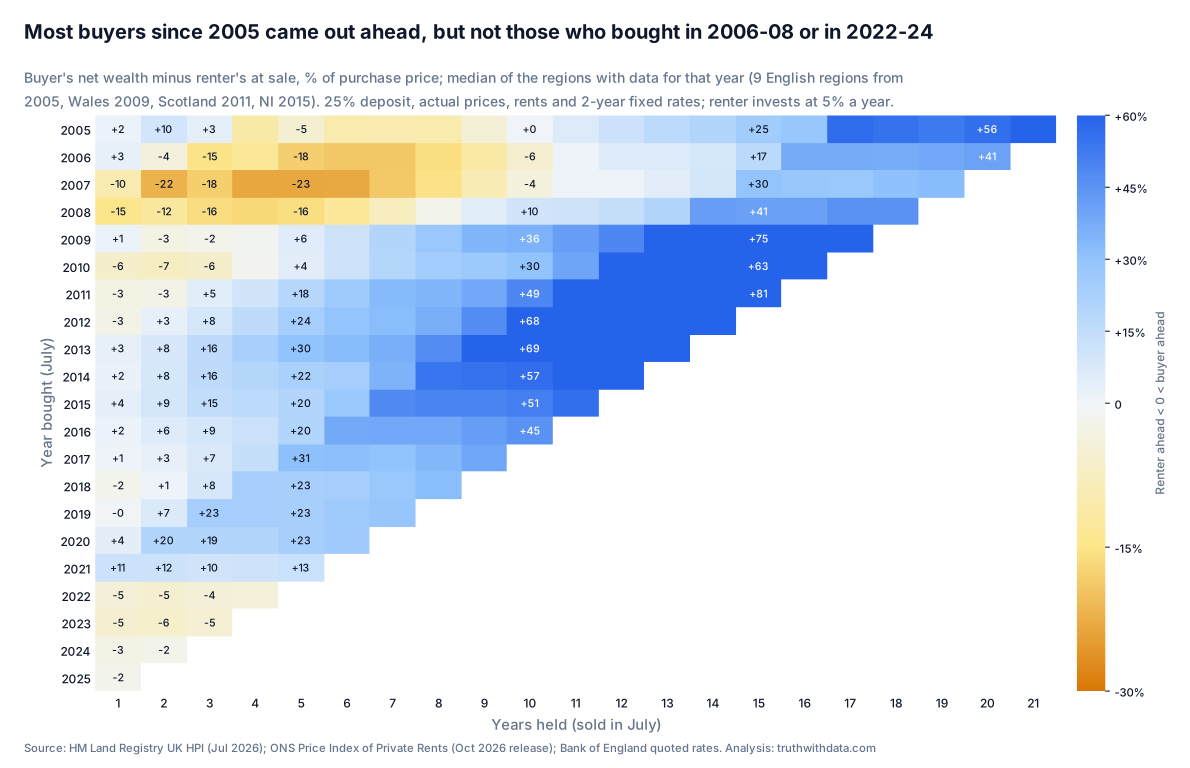
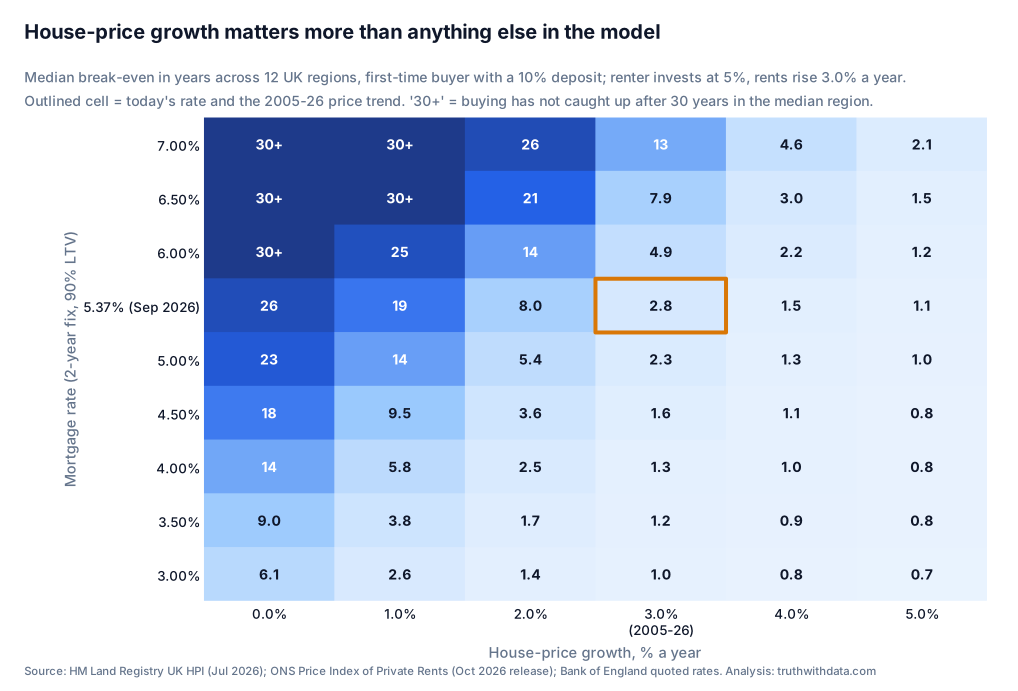
The useful output is not a single answer but the conditions under which each answer holds, which is what a good decision model should give you.
04Where this applies
Lenders and brokers
Affordability and break-even tools for customers that show the risks as well as the upside, with rates and prices you can update monthly.
Fintech and proptech
A calculator engine checked against an independent implementation, ready to sit behind an app or a lead-generation page.
Advisers and HR teams
Relocation, lease-or-buy and build-or-rent decisions use the same structure: two cash-flow paths, equal spend, every cost counted.
Any "now or later" decision
Lease vs buy equipment, cloud vs on-premises, subscribe vs own. Backtest the rule of thumb before trusting it.
05Limits
What the model leaves out
- The forward model holds the mortgage rate constant; the sensitivity grid shows how much that matters.
- The renter earns a steady 5% a year. Real investment returns are lumpy, and that assumption probably flatters buyers in 2009–2021.
- Today's stamp duty rules are applied to past purchases in the backtest, which understates tax before 2014.
- It compares the average home in an area; any one home and household will differ.
06How we would do this for you
Map the decision
Every cash flow, assumption and data source written down and agreed before any code is written.
Model, backtest, stress
The simulation, a backtest on your history, and sensitivity grids for the inputs nobody can forecast.
Ship the tool
A calculator or dashboard verified against the model, plus a monthly data-refresh script.
07Reproduce it
Data: HM Land Registry UK House Price Index; ONS Price Index of Private Rents; Bank of England quoted mortgage rates.
This is an independent project built on public data to show how we work. It is not client work, and no client data was used. Figures are reproducible from the published code.